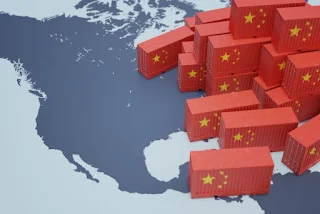
CHINESE FOREIGN TRADE IN FIGURES
|
Foreign Trade
Values |
2015 |
2016 |
2017 |
2018 |
2019 |
|
Imports of Goods (million
USD) |
1,681,951 |
1,587,431 |
1,843,793 |
2,135,748 |
2,078,386 |
|
Exports of Goods (million
USD) |
2,274,949 |
2,098,161 |
2,263,345 |
2,486,695 |
2,499,457 |
|
Imports of Services (million
USD) |
466,330 |
453,014 |
464,133 |
520,683 |
496,967 |
|
Exports of Services (million
USD) |
285,476 |
208,488 |
226,389 |
269,697 |
281,651 |
Source: World Trade Organisation (WTO) ; Latest
available data
|
Foreign Trade
Indicators |
2016 |
2017 |
2018 |
2019 |
2020 |
|
Foreign Trade (in
% of GDP) |
36.9 |
37.6 |
37.5 |
35.8 |
34.5 |
|
Trade Balance (million
USD) |
488,883 |
475,941 |
380,074 |
392,993 |
515,000 |
|
Trade Balance (Including
Service) (million USD) |
255,737 |
217,010 |
87,905 |
131,844 |
369,673 |
|
Imports of Goods and
Services (in % of GDP) |
17.3 |
17.9 |
18.3 |
17.3 |
16.0 |
|
Exports of Goods and
Services (in % of GDP) |
19.6 |
19.7 |
19.1 |
18.5 |
18.5 |
Source: World Bank ; Latest available data
|
Foreign Trade
Forecasts |
2020 |
2021 (e) |
2022 (e) |
2023 (e) |
2024 (e) |
|
Volume of exports of goods
and services (Annual % change) |
2.0 |
6.9 |
4.3 |
3.4 |
3.9 |
|
Volume of imports of goods
and services (Annual % change) |
-1.5 |
6.9 |
7.5 |
3.5 |
4.3 |
Source: IMF, World Economic Outlook ; Latest available
data
Note: (e)
Estimated Data
|
Main Customers |
2019 |
|
United States |
16.8% |
|
Hong Kong |
11.2% |
|
Japan |
5.7% |
|
South Korea |
4.4% |
|
Vietnam |
3.9% |
|
Germany |
3.2% |
|
India |
3.0% |
|
Netherlands |
3.0% |
|
United Kingdom |
2.5% |
|
Singapore |
2.2% |
|
Main Suppliers |
2019 |
|
South Korea |
8.4% |
|
Japan |
8.3% |
|
United States |
6.0% |
|
Australia |
5.8% |
|
Germany |
5.1% |
|
Brazil |
3.8% |
|
Malaysia |
3.5% |
|
Vietnam |
3.1% |
|
Russia |
2.9% |
|
Saudi Arabia |
2.6% |
Source: Comtrade, Latest Available Data
Main products
|
2,498.6 bn
USD of products exported in 2019 |
|
|
Electrical apparatus for
line telephony or line... |
9.0% |
|
Automatic data processing
machines and units... |
5.9% |
|
Electronic integrated
circuits and microassemblies |
4.1% |
|
Petroleum oils and oils
obtained from bituminous... |
1.5% |
|
Diodes, transistors and
similar semiconductor... |
1.4% |
|
Parts and accessories for tractors, motor vehicles... |
1.3% |
|
Lamps and lighting fittings, incl. searchlights... |
1.3% |
|
Parts and accessories (other than covers, carrying...Parts and
accessories (other than covers, carrying cases and the like) suitable for use
solely or principally with machines of heading 8469 to 8472, n.e.s. |
1.3% |
|
Toys (excl. wheeled toys designed to be ridden by... |
1.3% |
|
Television receivers, whether or not incorporating... |
1.2% |
|
2,069.0 bn
USD of products imported in 2019 |
|
|
Electronic integrated
circuits and microassemblies |
14.8% |
|
Petroleum oils and oils
obtained from bituminous... |
11.5% |
|
Iron ores and
concentrates, incl. roasted iron... |
4.8% |
|
Petroleum gas and other
gaseous hydrocarbons |
2.5% |
|
Motor cars and other motor
vehicles principally... |
2.3% |
|
Gold, incl. gold plated with platinum, unwrought... |
2.1% |
|
Electrical apparatus for line telephony or line... |
2.1% |
|
Soya beans, whether or not broken |
1.7% |
|
Copper ores and concentrates |
1.6% |
|
Automatic data processing machines and units...Automatic data
processing machines and units thereof; magnetic or optical readers, machines
for transcribing data onto data media in coded form and machines for
processing such data, n.e.s. |
1.5% |
Source:
Comtrade, Latest Available Data
Main Services
|
209.0 bn USD
of services exported in 2018 |
|
|
Other business services |
31.66% |
|
Transportation |
20.25% |
|
Travel |
19.33% |
|
Computer and information
services |
14.37% |
|
Construction services |
6.49% |
|
Royalties and license fees |
2.66% |
|
Insurance services |
2.36% |
|
Financial services |
1.60% |
|
Government services |
0.84% |
|
Cultural and recreational services |
0.46% |
|
523.0 bn USD
of services imported in 2018 |
|
|
Travel |
53.03% |
|
Transportation |
20.88% |
|
Other business services |
8.99% |
|
Royalties and license fees |
6.84% |
|
Computer and information
services |
4.50% |
|
Insurance services |
2.21% |
|
Construction services |
1.65% |
|
Government services |
0.86% |
|
Cultural and recreational
services |
0.65% |
|
Financial services |
0.40% |
Source: United
Nations Statistics Division, Latest Available Data
Exchange Rate System
Local Currency
Chinese Yuan (Renminbi)
(CNY)
Exchange Rate Regime
Managed floating exchange
rate regime, allowing Central Bank interventions.
Level of Currency
Instability
Significant risks of
instability. Volatility may increase with China’s economic slowdown, a change
in U.S. monetary policy or international pressures on the Government for a
revaluation of the currency.
Exchange Rate on August
31, 2021:
1 CNY = 0.1545 USD, 1 USD =
6.4714 CNY
1 CNY = 0.1309 EUR, 1 EUR = 7.6399 CNY
|
Monetary
Indicators |
2015 |
2016 |
2017 |
2018 |
2019 |
|
Chinese Yuan (Renminbi)
(CNY) - Average Annual Exchange Rate For 1 EUR |
6.65 |
7.07 |
7.63 |
7.81 |
7.75 |
Source: World Bank - Latest available data.


.jpg)
